Monday, July 25, 2011

The Moon, in color

The United States Geological Survey teamed up with NASA from 1971 to 1998 to create a series of beautiful maps of the Moon and other planets. These maps are color-coded to show geological materials and phenomena, and the result is something that wouldn't look amiss hanging in an art gallery. Here's a portion of the map of the far (or 'dark,' if you prefer) side of the Moon:


And here is one of the Moon's western hemisphere:


You can check out the Wired article on these maps here.

Wednesday, July 20, 2011

People movin'

Carlo Zapponi has created a wonderful visualization of the world's migration patterns as of 2010 using HTML5 technology. The project, called PeopleMovin and found at http://peoplemov.in, has lots of information about migration in general as well as the country-specific numbers. For instance, about 3.15% of the world's population lives outside of their countries, and the United States is the most popular migrant destination. Refugees and asylum-seekers make up about 8% of all international migrants, and the majority of those (65%) come from North Africa and the Middle East.

This website is set up fairly intuitively, with two long columns stretching down the page, split into sections representing countries. If you click on a bar on the left-hand side, information will come up concerning the number of people who left the country and the country they went to. Here's the information for the United States:


The lines connect to the corresponding countries on the right-hand bar, and the thickness of the lines indicates the number of people who moved.

If you click on a bar on the right-hand side, you'll get information for all the people who moved into that particular country, and their countries of origin. Again, the thickness of the line indicates the number of people. Here's the United States:


It's really a beautiful interface, and it's very easy to lose some time playing around with it.

Monday, July 18, 2011

GOOD has mapped out some of history's most famous journeys, both fictional and factual, in an interactive map supplemented with information from each trip.

Here's a snapshot from Lewis and Clark's expedition:


Looks like Lewis found out the hard way that bears are serious business, though luckily he came out victorious in the end.

Read more about the map here.

Friday, July 15, 2011

World disaster map

The RSOE (the Hungarian National Association of Radio Distress-Signaling and Infocommunications) has created an EDIS: an Emergency and Disaster Information Service map that displays, in near-real time, events happening around the world.

Screen captures are from July 12, 2011.
 
You can click on any event's icon to get more information about it. For instance, on this particular day, there was an icon in Michigan:


Clicking on the "Details" link at the bottom of the bubble that pops up leads you to more information about the selected disaster or emergency. This particular one was concerning the storms that had been taking place.

It's an interesting and very visual way to keep up with what's going on in the world.

Tuesday, July 12, 2011

The birth of a nation

For the first time since Eritrea split from Ethiopia in 1993, a new country has been born. Africa's largest country has been divided: on July 9th, 2011, midnight (local time), South Sudan became an independent state. They had held a vote in January 2011 wherein the response was overwhelmingly in favor of independence. The region had been torn by civil war for decades, leading to deplorable conditions and the deaths of as many as two million people. In 2005, a peace deal was signed, and six years later the plans for secession have come to fruition.

Image from http://www.itbhuglobal.org/chronicle/archives/2011/02/sudan_leader_to.php

Sudan is predominantly Arabic and Muslim, while South Sudan has much more diversity, with over 200 ethnic groups, each with its own languages and traditional beliefs, alongside Islam and Christianity. These religious differences were a major cause for the strife between the two regions, as the North wanted to enforce Sharia law over the entire country.

The BBC has a great series of maps that show the differences between Sudan and South Sudan in many different areas, including ethnic groups, education, and food insecurity.

Though people are euphoric over the separation, South Sudan still has a lot of work ahead of it. It needs to disentangle its economy from Sudan. The first step is introducing its own currency, which will happen later this month. But another difficulty is the fact that South Sudan has the means to produce oil, but pipelines to transport it are in the North. There are huge problems with access to clean drinking water, food, and education. Infant and maternal mortality rates are high. And of course there is always the danger that a war-torn region might fall back on violence.

But there is hope for the fledgling nation, and Sudanese who left the country while it was under the rule of the North are making their way back home to the newly-independent South Sudan to help give it the best beginning it can have.

There is a lot of information out there, but here are a few good places to start: News from the New York Times, news from the BBC, and South Sudan's own website.

Friday, July 08, 2011

The Connected States of America

Researchers at MIT Senseable City Lab, AT&T Research Labs, and IBM Research have teamed up and compiled a lot of anonymized data to create this interactive map that shows how counties interact with one another on the AT&T network. You can click on your county, or enter its name into the box at the left side of the screen, and see which counties across the nation are communicating the most.


Here is the call-time map for Washtenaw county. Other counties in Michigan and some surrounding areas get talked to quite a bit, as well as a few chunks of the East coast, West coast, and Florida.

You can also switch the map to show SMS data instead of call time, which gives you a slightly different picture:

Though the data is slightly different, the hot spots remain unchanged, for the most part.

You can read more about this research here.

Wednesday, July 06, 2011

Drought in the Southwest

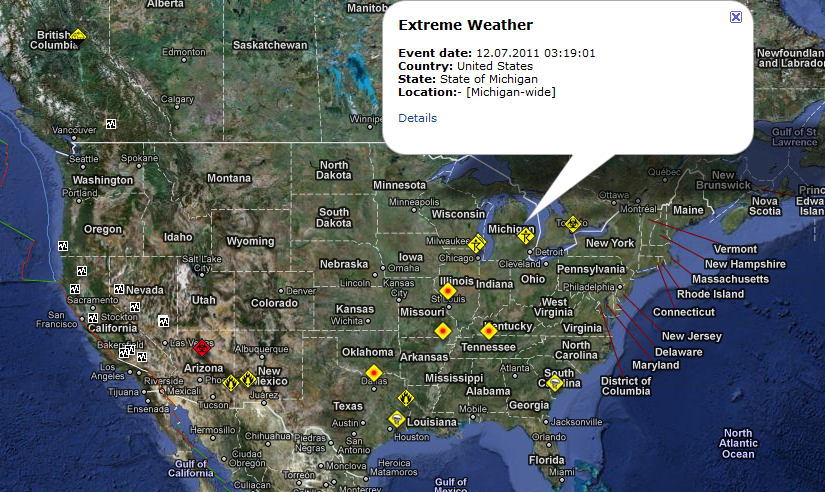
While some areas of the country are having an overabundance of water, the Southwest is struggling with a lack of moisture. The U.S. Drought Monitor has a lot of interesting maps and data that show the changing levels across the nation. Their archive is very helpful, as it lets you compare two sets of data side by side.

For instance, we can compare this year's most recent map with a map created last year at the same time.


A large portion of the southernmost part of the map is taken up by dark red, indicating an exceptional drought. Texas is hit exceptionally hard.


When this year's map is compared to the map from 2010, it's plain to see that conditions are much worse this year. Though 2010 was not without its 'abnormally dry' patches, there were no 'exceptional droughts.'


The archive can show a table with numerical data for the selected months as well. For the June 28, 2011 map, 11.94% of the United States is experiencing an exceptional drought, and areas with less severe droughts are also increased.

In fact, another feature of the archives at the U.S. Drought Monitor is a graph that shows the data since January of 2000.


The data on this graph goes back more than a decade, and the dark red bump we're currently on is the biggest yet, with 11.84% of America's land suffering from that extreme drought. For comparison, the next-biggest bump, in mid-2002, had the extreme drought percentage at 7.85.

So let's all think rainy thoughts for our southern states, and hope that the drought ends soon and without much more impact than it's already had.

Monday, July 04, 2011

Remember your roots

Fifty, nifty, United States, from the thirteen original colonies~

On our nation's birthday, it's important to remember our roots:

From Wikipedia
Whatever your plans today, stop and take a moment to think of the crazy ride that got us to where we are today, and see if you can muster the patriotism for a hearty, unironic chant of "USA! USA! USA!" (It's okay if you just do it in your head.)

And please celebrate responsibly! For your viewing pleasure I have obtained this map from Buzzfeed that color-codes the fireworks laws for each state.


So remember, my fellow Michigan people: please keep it "safe and sane," but still have fun! Happy Fourth of July, everyone!

Friday, July 01, 2011

1905 San Francisco Atlas Digitized

Just months before the San Francisco quake and fire of 1906, this Sanborn Insurance Atlas was published. It shows the city in great detail how it was just before the disaster. Recently, the six-volume atlas was digitized and made available on David Rumsey's site, so these remarkable pictures are available for everyone to see.


The atlases themselves are not unmarked by one of the worst natural disasters ever to strike the United States-- as you can see, the edges of the pages are somewhat damaged. Really, it's incredible that they survived a two-pronged event that left people homeless for years, permanently changed the course of rivers, destroyed about 25,000 buildings, and left a city looking like this:

Photo by Arnold Genthe
It's also of note that this was one of the first disasters to be documented by photograph and motion picture. Here is the photographer's description of the picture, which was taken the day the fires started:

"I found that my hand cameras had been so damaged by the falling plaster as to be rendered useless. I went to Montgomery Street to the shop of George Kahn, my dealer, and asked him to lend me a camera. 'Take anything you want. This place is going to burn up anyway.' I selected the best small camera, a 3A Kodak Special. I stuffed my pockets with films and started out.... Of the pictures I had made during the fire, there are several, I believe, that will be of lasting interest. There is particularly the one scene that I recorded the morning of the first day of the fire [along Sacramento Street, looking toward the Bay] which shows, in a pictorially effective composition, the results of the earthquake, the beginning of the fire and the attitude of the people. On the right is a house, the front of which had collapsed into the street. The occupants are sitting on chairs calmly watching the approach of the fire. Groups of people are standing in the street, motionless, gazing at the clouds of smoke. When the fire crept up close, they would just move up a block. It is hard to believe that such a scene actually occurred in the way the photograph represents it. Several people upon seeing it have exclaimed, "Oh, is that a still from a Cecil De Mille picture?" To which the answer has been, "No. the director of this scene was the Lord himself." A few months ago an interview about my work--I had told the story of that fire picture--appeared in a New York paper with the headline, "His pictures posed by the Lord, says photographer.""
-Arnold Genthe, "As I Remember" Reynal & Hitchcock : New York, 1936

And if you would prefer to see the pre-quake-and-fire San Francisco as drawings instead of maps and building plans, Rumey's site also has a digitized Illustrated Directory from 1895.