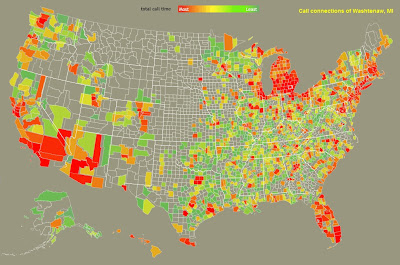
Researchers at MIT Senseable City Lab, AT&T Research Labs, and IBM Research have teamed up and compiled a lot of anonymized data to create this interactive map that shows how counties interact with one another on the AT&T network. You can click on your county, or enter its name into the box at the left side of the screen, and see which counties across the nation are communicating the most.
Here is the call-time map for Washtenaw county. Other counties in Michigan and some surrounding areas get talked to quite a bit, as well as a few chunks of the East coast, West coast, and Florida.
You can also switch the map to show SMS data instead of call time, which gives you a slightly different picture:
Though the data is slightly different, the hot spots remain unchanged, for the most part.
You can read more about this research here.


No comments:
Post a Comment